Get Started
This Get Started guide is intended as a quick way to start programming with leafmap. You can try out leafmap by using Google Colab ( ) or Binder (
 ) without having to install anything on your computer.
Plotting backends
Leafmap offers several plotting backends that share a similar Map API. Choose one by importing the corresponding module:
| Import | Backend | Best for |
|---|---|---|
import leafmap |
ipyleaflet (default) | Interactive analysis with the built-in toolbar, drawing tools and widgets |
import leafmap.foliumap as leafmap |
folium | Lightweight maps, exporting to HTML, and Streamlit apps |
import leafmap.maplibregl as leafmap |
MapLibre GL JS | Vector tiles, 3D terrain and buildings, custom styles, PMTiles |
import leafmap.deckgl as leafmap |
lonboard (deck.gl) | Fast rendering of very large vector datasets |
import leafmap.deck as leafmap |
pydeck | deck.gl layers such as hexagon and 3D column layers |
import leafmap.kepler as leafmap |
kepler.gl | Exploratory visualization with the kepler.gl user interface |
import leafmap.plotlymap as leafmap |
plotly | Maps combined with plotly charts and dashboards |
import leafmap.bokehmap as leafmap |
bokeh | Maps inside bokeh plots and apps |
By default, import leafmap uses the ipyleaflet backend. In marimo notebooks, import leafmap uses the folium backend instead.
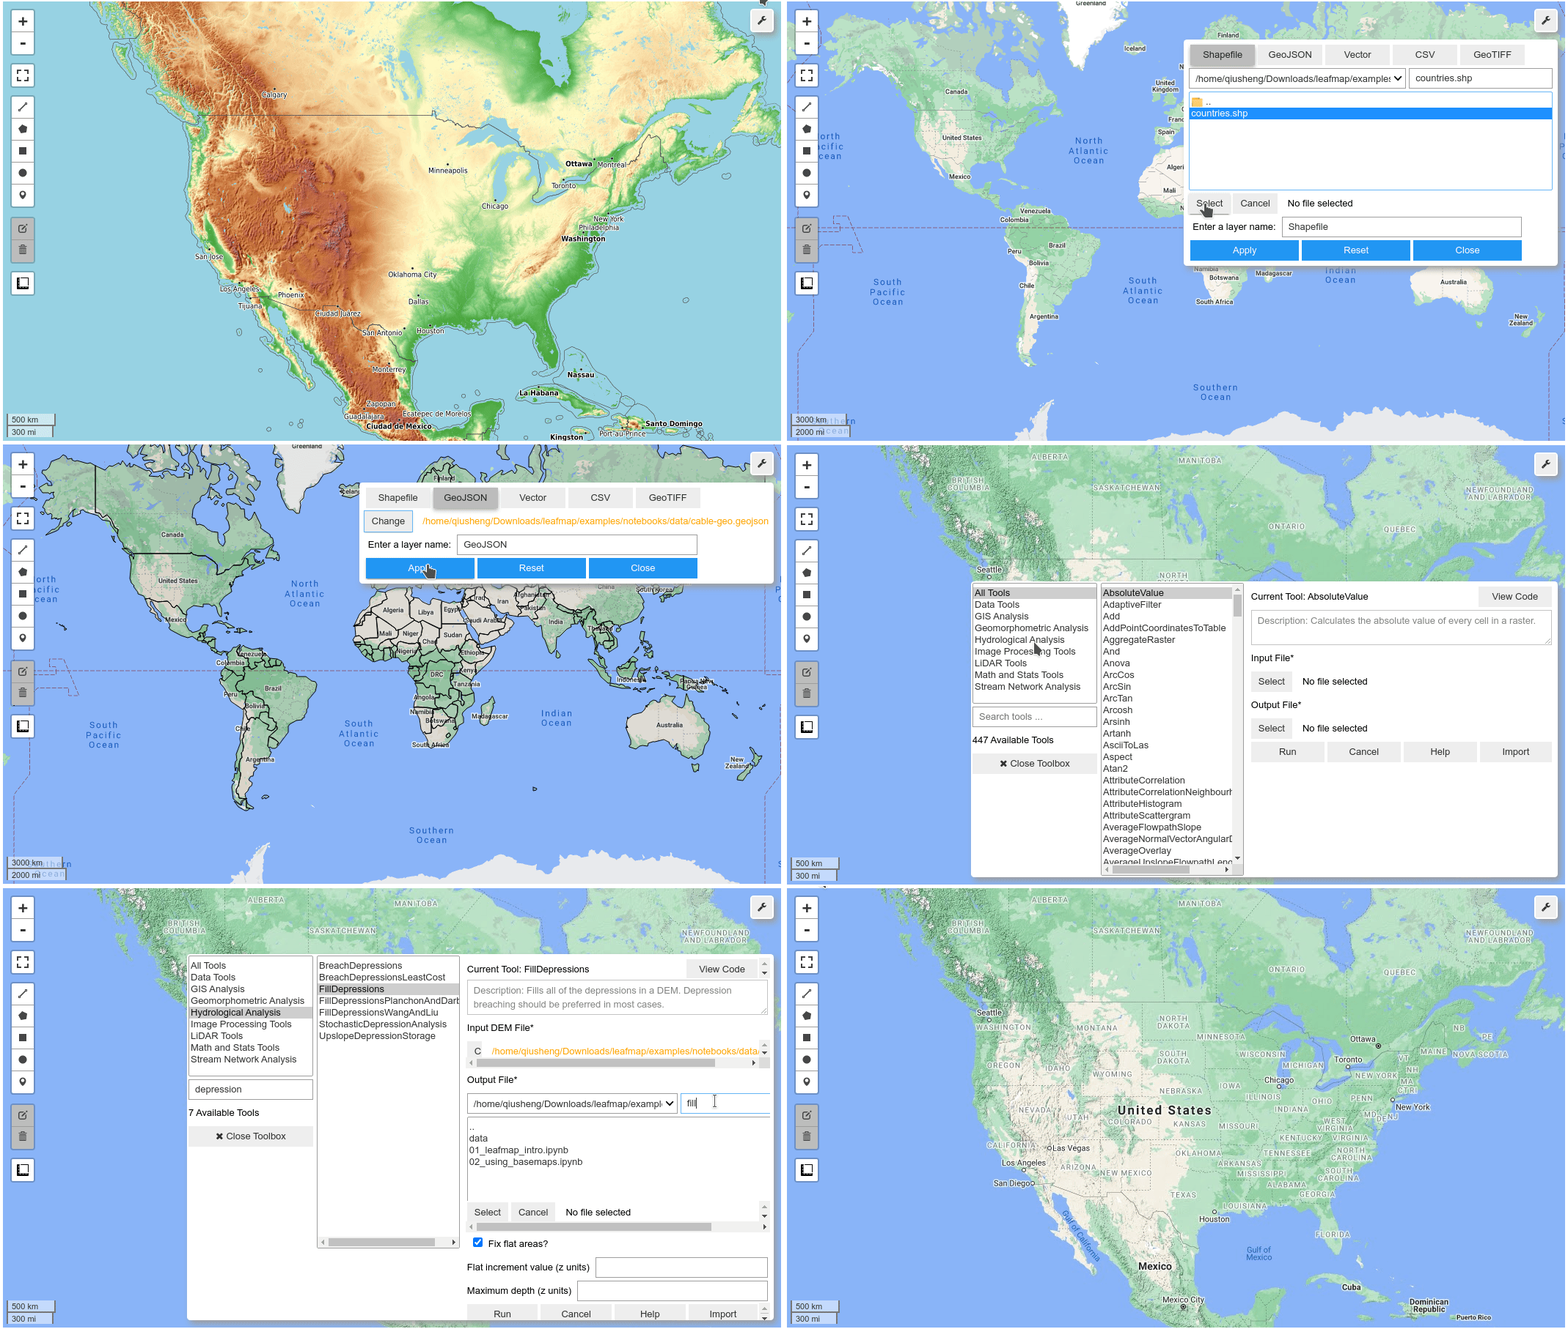
The backends do not offer equal functionality. The ipyleaflet backend provides the richest interactive functionality, including a custom toolset for loading, analyzing, and visualizing geospatial data without coding. For example, users can add vector data (e.g., GeoJSON, Shapefile, KML, GeoDataFrame) and raster data (e.g., GeoTIFF, Cloud Optimized GeoTIFF [COG]) to the map with a few clicks (see Figure 1). Users can also perform geospatial analysis using the WhiteboxTools GUI with hundreds of geoprocessing tools directly within the map interface (see Figure 2). Other interactive functionality (e.g., split-panel map, linked map, time slider, time-series inspector) can also be useful for visualizing geospatial data. The ipyleaflet package is built upon ipywidgets, which allows bidirectional communication between the front-end and the Python kernel, so the map can capture user input such as clicks and drawn shapes. In contrast, folium produces static HTML maps and cannot send user input back to Python. The maplibregl backend supports vector tiles, 3D visualization and a growing set of interactive widgets, while deckgl, deck and kepler are well suited for rendering large datasets.
 Figure 1. The leafmap user interface built upon ipyleaflet and ipywidgets.
 Figure 2. The WhiteboxTools graphical user interface integrated into leafmap.
Leafmap modules
The key functionality of the leafmap Python package is organized into the modules shown in the table below. See the API Reference for details on each module.
| Module | Description |
|---|---|
| basemaps | A collection of XYZ and WMS tile layers to be used as basemaps |
| bokehmap | A plotting backend built upon the bokeh Python package |
| cli | The leafmap, view-raster and view-vector command-line tools |
| colormaps | Commonly used colormaps and palettes for visualizing geospatial data |
| common | Functions used by multiple plotting backends to process geospatial data |
| deck | A plotting backend built upon the pydeck Python package |
| deckgl | A plotting backend built upon the lonboard Python package |
| download | Functions for downloading NAIP imagery, Overture Maps data and more |
| fire | Functions for searching and visualizing wildfire perimeters |
| foliumap | A plotting backend built upon the folium Python package |
| kepler | A plotting backend built upon the keplergl Python package |
| leafmap | The default plotting backend built upon the ipyleaflet Python package |
| legends | Built-in legends for commonly used geospatial datasets |
| map_widgets | Reusable widgets such as legends, colorbars and inspectors |
| maplibregl | A plotting backend built upon MapLibre GL JS |
| osm | Functions for extracting and downloading OpenStreetMap data |
| pc | Functions for working with Microsoft Planetary Computer |
| plot | Functions for creating charts (bar, line, histogram, pie) with plotly |
| plotlymap | A plotting backend built upon the plotly Python package |
| stac | Functions for searching and visualizing STAC catalogs and COGs via TiTiler |
| terrascope | Functions for accessing Terrascope data |
| toolbar | A custom toolset with interactive tools built upon ipywidgets and ipyleaflet |
Launch Jupyter
1 2 | |
Use the ipyleaflet plotting backend
1 2 3 4 5 | |

Use the folium plotting backend
1 2 3 4 | |

Use the MapLibre plotting backend
1 2 3 4 | |
Note that MapLibre uses (longitude, latitude) order for center, while the ipyleaflet and folium backends use (latitude, longitude).
Add your own data
With the default ipyleaflet backend, adding vector and raster data takes a few lines of code. Most other backends offer similar methods, but not all of them support every data type (for example, leafmap.deck and leafmap.kepler have no add_cog_layer()), so check the API Reference for the backend you use.
1 2 3 4 5 6 7 8 9 10 11 12 | |
Use the command line
Leafmap also installs command-line tools to quickly view a raster or vector file in the browser without writing any code. See Command-line interface for details.
1 2 | |
Leafmap demo with the ipyleaflet backend